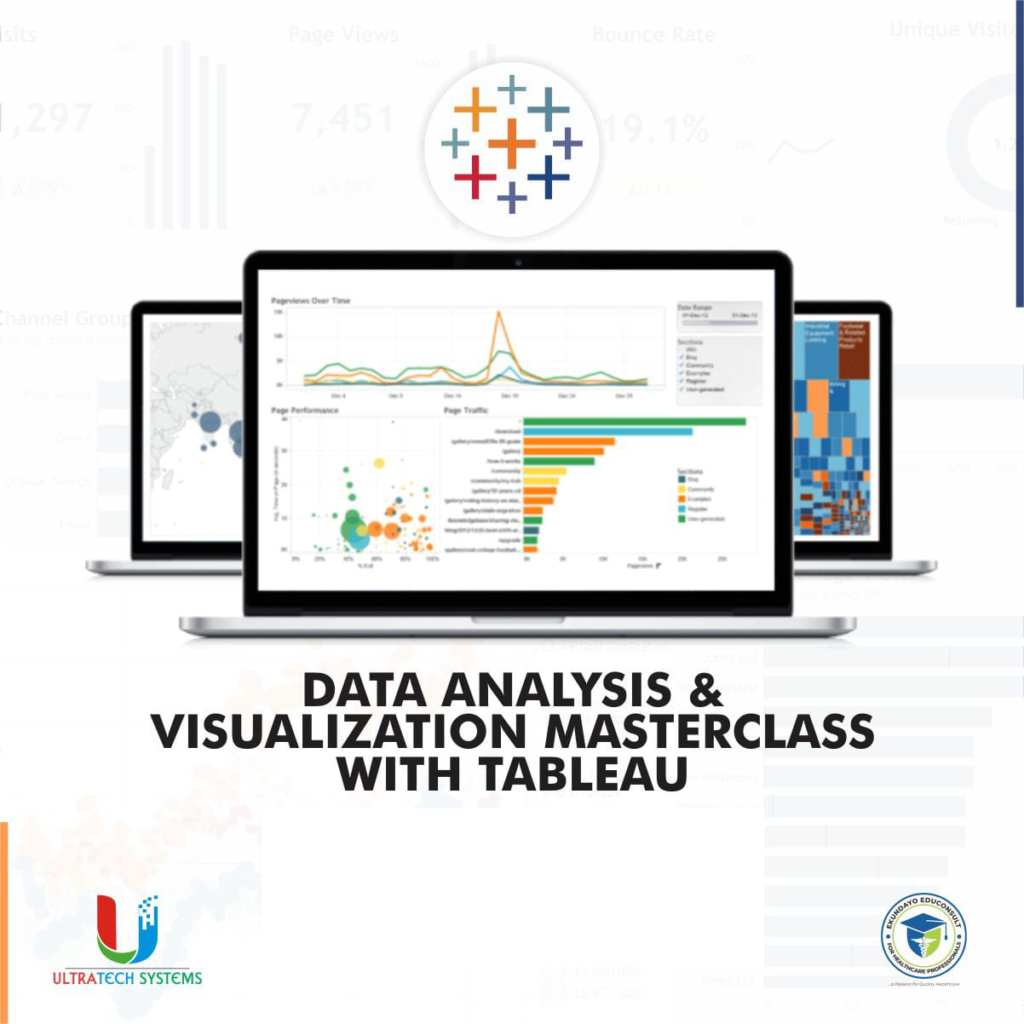
Introduction: The Importance of Data Visualization
In today’s data-driven world, visualizing information effectively is key to uncovering actionable insights. Tableau, a leading data visualization tool, helps professionals create interactive dashboards and visualizations that simplify decision–making.
Our Data Visualization Tableau Masterclass is perfect for professionals seeking to elevate their skills in data presentation and storytelling using Tableau.
1. Course Overview: What You’ll Learn
This masterclass provides in-depth training on:
- Navigating the Tableau interface.
- Connecting and preparing data for visualization.
- Building dynamic dashboards.
- Implementing advanced visualization techniques.
- Best practices for data storytelling and presentation.
2. Getting Started with Tableau
- Introduction to Tableau: An overview of its features and capabilities.
- Setting Up Tableau: Install Tableau and explore the interface.
- Connecting to Data: Import data from multiple sources like Excel, SQL, and cloud platforms.
3. Building Basic Visualizations in Tableau
- Bar Charts and Line Charts: Learn how to create these essential visualization types.
- Pie Charts and Geographic Maps: Visualize proportions and location-based data.
- Tables and Heatmaps: Use these formats for comparative and dense datasets.
4. Advanced Features for Dynamic Dashboards
- Interactive Elements: Add filters, tooltips, and actions to enhance user engagement.
- Real-Time Data Integration: Learn to work with live data connections.
- Dashboard Layout Best Practices: Design dashboards for clarity and impact.
5. Practical Applications of Tableau in Various Industries
- Marketing Analytics: Track campaign success and optimize strategies.
- Financial Reporting: Visualize budgets, forecasts, and ROI.
- Healthcare Data: Interpret patient and operational metrics.
- Supply Chain Insights: Monitor inventory, shipping, and logistics performance.
6. Sharing and Publishing Tableau Visualizations
- Exporting Your Work: Save and share visualizations in different formats.
- Collaborative Tools: Publish dashboards for team access via Tableau Server or Tableau Online.
7. Tips, Tricks, and Best Practices for Tableau Users
- Keyboard Shortcuts: Work efficiently with key Tableau commands.
- Custom Themes and Colors: Align visualizations with branding guidelines.
- Optimizing Performance: Handle large datasets without slowing down Tableau.
8. Testimonials and Success Stories
“The Data Visualization Tableau Masterclass provided me with practical skills I use daily to present complex data.”
– Maria J., Business Analyst
“This course demystified Tableau and gave me confidence to build dashboards that make a real impact.”
– David K., Data Scientist
9. Conclusion: Elevate Your Data Visualization Skills
Data visualization is about creating clarity from complexity. With our Data Visualization Tableau Masterclass, you’ll learn to transform data into insights that drive decisions. Whether you’re new to Tableau or looking to deepen your expertise, this course provides everything you need to succeed.
Enroll now and start your journey to Tableau mastery today!

Data is not just numbers, it’s a narrative waiting to be told.
Enroll for our DATA VISUALIZATION WITH TABLEAU MASTERCLASS and learn how to weave a compelling story with data that drives action, sparks insight, and inspires change!
Don’t just present data, tell a story that resonates. Get the training videos, datasets, workbooks, and templates now!

